
Monitoring vs. Observability: Understanding the Critical Difference
The terms "monitoring" and "observability" are frequently conflated, but they address fundamentally different operational challenges:
- Monitoring is for "Known-Knowns": Traditional monitoring tracks predefined metrics against static thresholds—such as CPU utilization exceeding 85%, memory usage crossing 90%, or a disk volume reaching 80% capacity. It answers the binary question: "Is this specific server component behaving within expected operational bounds?"
- Observability is for "Unknown-Unknowns": Modern distributed systems fail in unpredictable, emergent ways: a subtle lock contention in a database connection pool that only triggers when a specific customer exports an invoice with 5,000 line items while a background worker flushes cache keys. Observability enables an on-call engineer to interrogate high-cardinality telemetry and ask: "Why are 3% of users in the EU region experiencing timeouts on checkout while overall error rates remain below 0.1%?"
Achieving true observability requires orchestrating three interdependent telemetry signals—logs, metrics, and traces—so that an engineer can pivot seamlessly from a high-level alert directly into the offending line of code within seconds.
The Three Pillars of Telemetry: Connecting the Signals
1. Structured Logs (Contextual Truth)
Unstructured string logs (e.g., logger.info("Order processed for user " + userId)) are useless in modern distributed environments because they cannot be parsed efficiently at scale. Production systems enforce structured JSON logging with standardized schema keys:
{
  "timestamp": "2026-10-19T14:22:08.142Z",
  "level": "warn",
  "message": "Payment gateway latency threshold exceeded",
  "service": "billing-service",
  "environment": "production",
  "trace_id": "4bf92f3577b34da6a3ce929d0e0e4736",
  "span_id": "00f067aa0ba902b7",
  "tenant_id": "tenant_enterprise_882",
  "user_id": "usr_99182",
  "http_route": "POST /api/v1/invoices/pay",
  "duration_ms": 3482.1,
  "gateway_status": 200
}
Notice the inclusion of trace_id and span_id. When structured logs carry trace context, an engineer inspecting an anomaly in Grafana Loki or Elasticsearch can click a single button to render the full distributed trace waterfall across every service that touched the request.
2. Metrics & The RED Method (System Health at a Glance)
Metrics are numerically aggregated data points over fixed time intervals. They are extremely compact, cheap to store, and ideal for real-time dashboards and alerting. For request-driven SaaS architectures, leading SRE teams standardize on the RED Method (championed by Tom Wilkie):
- Rate: The number of requests your service serves per second (throughput/QPS).
- Errors: The number of requests that fail per second (HTTP 5xx status codes, unhandled exceptions).
- Duration: The amount of time requests take to complete, represented as latency percentiles (p50, p95, p99), never simple arithmetic averages.
3. Distributed Tracing: The Connective Tissue
Distributed tracing is the defining requirement of modern microservices. When a browser initiates a single user action (such as loading a dashboard), that request may traverse an API gateway, hit three microservices, execute four database queries, and publish an event to Kafka. Distributed tracing assigns a globally unique Trace ID to the transaction and propagates it across network boundaries using the W3C TraceContext standard (traceparent header).
OpenTelemetry (OTel): The Universal Open Standard
In previous eras, adopting observability meant vendor lock-in: installing proprietary agents (Datadog, New Relic, Dynatrace) that embedded closed SDKs into application codebases. Today, the cloud-native industry has consolidated around OpenTelemetry (OTel), a flagship Cloud Native Computing Foundation (CNCF) project.
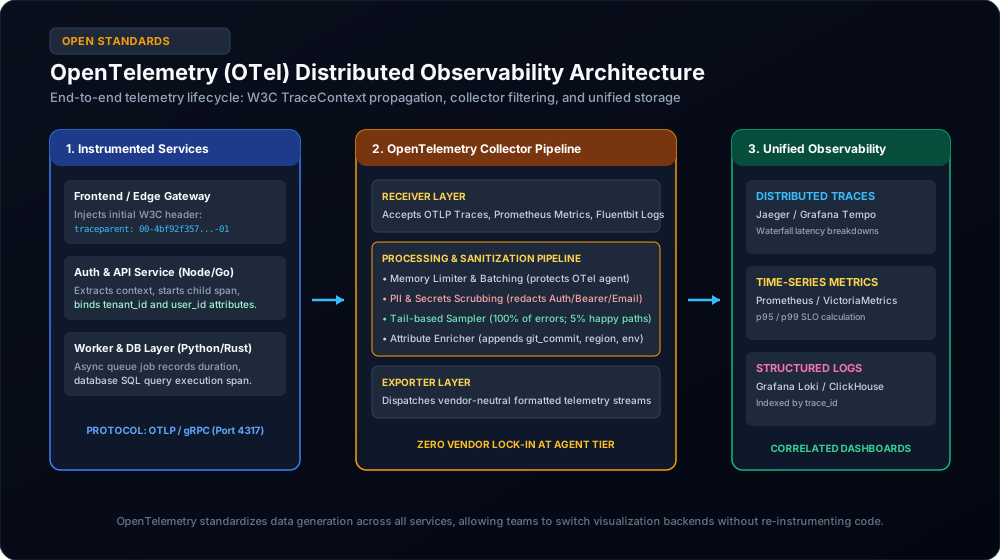
As detailed in Figure 1, the OpenTelemetry architecture decouples your application code from storage backends through three clean abstractions:
- OTel SDK Instrumentation: Injects vendor-neutral trace and metric wrappers into application frameworks (Express, FastAPI, Spring Boot, Go Chi) without mentioning any commercial APM vendor.
- The OpenTelemetry Collector: A high-performance Go-based daemon running as a Kubernetes sidecar or cluster gateway. The Collector receives data via OTLP (OpenTelemetry Protocol over gRPC), executes processors (scrubbing PII, dropping health-check spans, applying tail-based sampling), and exports data to storage backends.
- Flexible Backend Routing: The same telemetry stream can be mirrored simultaneously to Grafana Tempo for tracing, Prometheus for metrics, and an internal ClickHouse cluster for long-term analytical query storage. If you choose to switch backend tools next year, your application code requires zero modifications.
The Secret Killer: High-Cardinality Telemetry
In telemetry, cardinality refers to the number of unique possible values a dimension can hold. Low-cardinality dimensions include http_status (200, 404, 500) or cloud_region (us-east-1, eu-west-1). High-cardinality dimensions include user_id, order_id, or tenant_id—which can have millions of unique values.
Traditional time-series databases (like legacy Graphite or unmanaged Prometheus) fail catastrophically when high-cardinality labels are attached to metrics. Adding a tenant_id tag with 50,000 tenants multiplies the number of time-series streams by 50,000, exhausting server memory and causing commercial APM vendors to bill tens of thousands of dollars in overage fees.
tenant_id, customer_tier, invoice_uuid) to OpenTelemetry Trace Spans and Structured Log Payloads. Modern columnar backends (ClickHouse, OpenSearch, Grafana Tempo) index high-cardinality string keys effortlessly without metric cardinality explosions.
Alerting Without Fatigue: Symptom vs. Cause-Based Alerting
The single greatest operational hazard in fast-growing engineering teams is alert fatigue. When an engineer's phone buzzes at 3 AM because a worker node's CPU briefly crossed 85% during a routine cache warmup, the engineer learns to acknowledge the alert and go back to sleep. When a catastrophic database deadlock occurs three days later, the alert is drowned in the sea of noise.
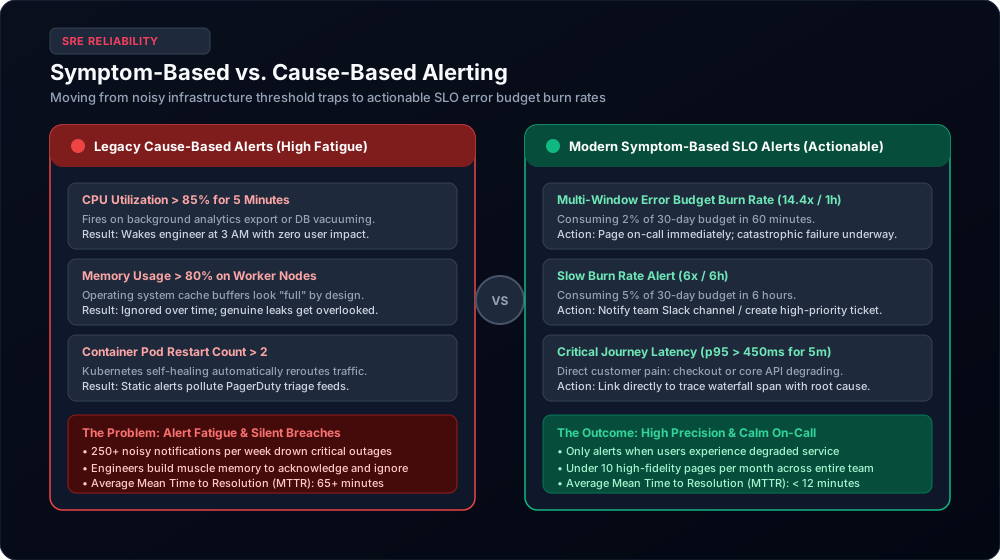
Figure 2 illustrates the fundamental paradigm shift pioneered in Google's Site Reliability Engineering methodology:
Why Cause-Based Alerts Fail
Cause-based alerts try to guess every internal mechanism that could possibly go wrong: CPU > 85%, disk space > 80%, pod restart count > 2. But modern software is resilient: Kubernetes automatically spins up replacement pods, and Linux kernel memory managers utilize free RAM for buffer cache by design. Cause-based alerts result in hundreds of false alarms per week that have zero impact on customer experience.
The Superior Model: Multi-Window Multi-Burn-Rate SLO Alerts
Instead of alerting on internal mechanics, symptom-based alerting monitors your Service Level Objectives (SLOs) and measures the rate at which your Error Budget is being consumed:
| Alert Tier | Burn Rate Condition | Budget Consumed | Paging Severity | Recommended On-Call Action |
|---|---|---|---|---|
| Critical Page | 14.4× Burn Rate over 1 Hour AND 5 Minutes | 2% of 30-day budget consumed in 60m | Immediate PagerDuty wake-up | Incident Commander mobilized; catastrophic customer failure in progress |
| High Urgency | 6× Burn Rate over 6 Hours AND 30 Minutes | 5% of 30-day budget consumed in 6h | Slack / Ticket priority page | Investigate during working hours; service degrading gradually |
| Medium Warning | 1× Burn Rate over 3 days | 10% of 30-day budget consumed in 72h | Jira backlog ticket | Prioritize in next sprint; persistent low-volume background error |
By enforcing multi-window burn rates (requiring both a short window and a long window to agree), transient single-second blips never wake an engineer, while catastrophic outages trigger pages within minutes.
SaaS Observability Maturity Model
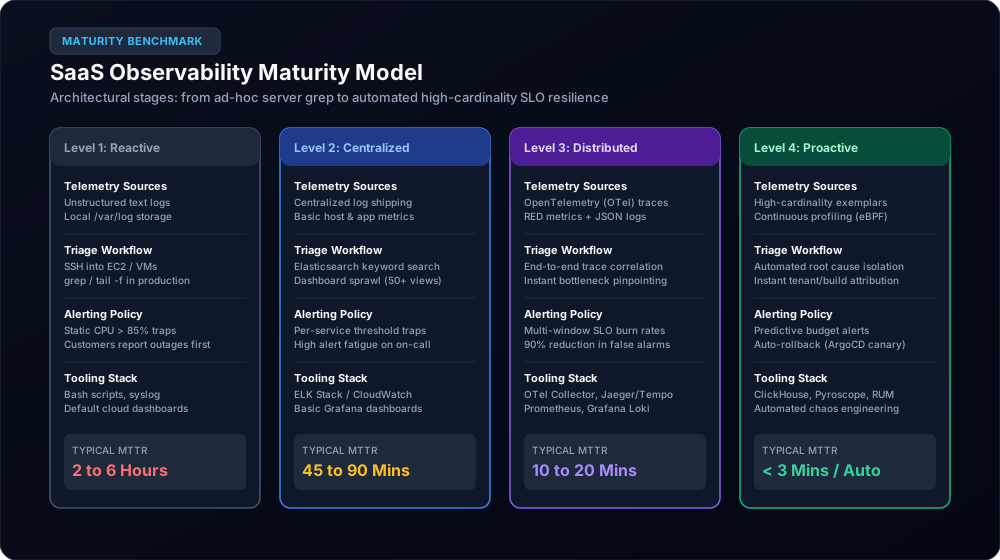
Where does your engineering organization stand today? Evaluate your infrastructure against the four maturity levels shown in Figure 3:
Practical Implementation Roadmap: Modernizing Your Stack
Transitioning to production-grade observability does not require a complete rewrite of your software. Follow this phased 5-step engineering plan:
- Standardize Structured JSON Logging: Replace unstructured logging libraries with structured formatters (Winston/Pino in Node.js, Zerolog/Zap in Go, Loguru in Python). Inject
service,environment, and standard timestamps across all services. - Deploy the OpenTelemetry Collector: Spin up an OTel Collector deployment in your Kubernetes cluster or container service. Configure it with standard OTLP receivers and exporters for your current logging or APM provider.
- Enable Automatic Tracing: Use OpenTelemetry auto-instrumentation packages to trace HTTP requests, database queries, and message broker publishers with zero manual span creation. Verify that W3C
traceparentheaders traverse all service boundaries. - Define 3 Core SLOs: Identify the three most critical user journeys (e.g., User Authentication, Search API, Payment Processing). Define Service Level Indicators (SLIs) for Availability (% of non-5xx responses) and Latency (p95 < 400ms) with a 99.5% target.
- Decommission Legacy Threshold Traps: Audit existing alerting rules. Delete static CPU and memory alerts, replacing them with multi-window error budget burn-rate alerts. Track your team's on-call MTTR and celebrate the decline in false pages.
Authoritative Engineering Sources & Further Reading
- Google Cloud Site Reliability Engineering: Monitoring Distributed Systems & Alerting on SLOs
- Cloud Native Computing Foundation (CNCF): OpenTelemetry Documentation & Specification
- World Wide Web Consortium (W3C): W3C Trace Context Specification
- Charity Majors & Liz Fong-Jones: Observability Engineering: Achieving Operational Excellence (O'Reilly Media)
Transform Your Engineering Team's Observability
Tired of 3 AM alert fatigue and multi-hour incident triage? Ramaaya Technologies helps scaling engineering teams architect vendor-neutral OpenTelemetry pipelines, implement SLO burn-rate alerting, and achieve sub-15-minute MTTR.