

The Core Paradox of Software Estimation
When business leaders ask, "How much will it cost to build this platform?", they are rarely asking how many hours a developer needs to type syntax into an IDE. They are asking what capital investment is required to deliver a secure, performant, maintainable software asset that reliably solves a strategic operational problem or generates enterprise revenue.
Yet the standard procurement ritual remains broken: business stakeholders draft a 15-page feature wishlist, send it to five agencies or consulting shops, and receive proposals ranging from \$35,000 to \$380,000. This disparity is rarely caused by vendor greed or predatory pricing. It stems from differing interpretations of the Cone of Uncertainty—an established engineering principle demonstrating that in the initial ideation phase of a software system, uncertainty spans a 4x factor in either direction.
A \$35,000 quote invariably assumes zero architectural edge cases, happy-path logic, no automated test suites, default un-hardened cloud templates, and complete client hand-holding. A \$250,000 quote from an experienced custom software engineering practice accounts for multi-tenant isolation, database failover, schema migrations, role-based access control (RBAC), end-to-end integration tests, and enterprise SLA reliability. To compare these quotes rationally, you must deconstruct the Work Breakdown Structure (WBS) that governs real software systems.
The Real Anatomy of a Software Budget: Work Breakdown Structure (WBS)
Professional engineering organizations do not estimate software by guessing a single round number. They disassemble the system into discrete, measurable modules across five architectural phases. Only when individual modules are evaluated with explicit complexity ratings can a credible budget emerge.
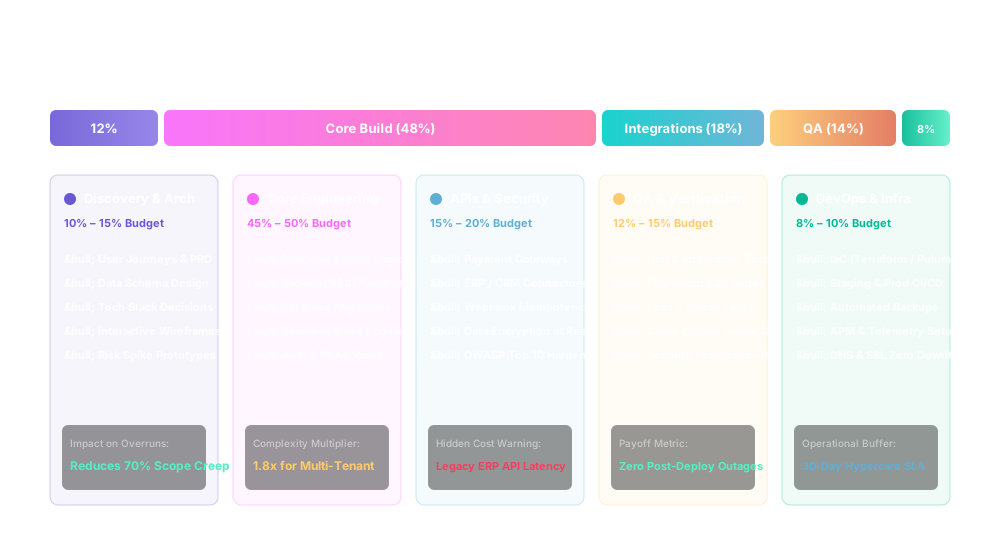
As illustrated in Figure 1, hands-on frontend and backend feature coding accounts for roughly 45% of direct engineering investment. The remaining 55% covers essential engineering disciplines that differentiate commercial software from throwaway prototypes:
- Phase 1: Architecture, Discovery & UX (12%–15%): Defining data models, domain boundaries, API contract schemas (OpenAPI/GraphQL), system state machines, wireframing, and interactive clickable prototypes to validate product workflows prior to writing code.
- Phase 2: Core Engineering & Business Logic (40%–45%): Developing backend services, data ingestion pipelines, relational and non-relational database models, frontend application states, component design systems, and external service connectors.
- Phase 3: Critical Integrations & Middleware (12%–15%): Integrating identity providers (Auth0/Cognito), payment processors (Stripe/Plaid), ERP/CRM endpoints (Salesforce/SAP), communications APIs (Twilio/SendGrid), and webhooks with idempotent retry mechanics.
- Phase 4: QA, Automated Verification & Security (15%–18%): Unit testing, integration test harnesses (Playwright/Cypress), load testing (k6), static application security testing (SAST), dependency vulnerability scanning, and pen-testing remediation.
- Phase 5: Cloud Infrastructure & CI/CD Deployment (10%–12%): Terraform/OpenTofu Infrastructure-as-Code (IaC), multi-stage container build pipelines (Docker/GitHub Actions), Kubernetes or ECS cluster orchestration, VPC networking, and Datadog/CloudWatch observability suites.
The Mathematical Estimation Model: Three-Point PERT
To eliminate subjective wishful thinking from software scoping, engineering teams rely on the Program Evaluation and Review Technique (PERT). For each feature or component in the WBS, three distinct values are estimated by senior engineers:
Standard Deviation (σ) = (Pessimistic - Optimistic) / 6
Consider estimating a mission-critical feature: Multi-tenant Stripe Billing with Usage Metering & Webhook Reconciliation:
- Optimistic (O): 40 hours (Stripe SDK integrates cleanly; zero legacy schema friction; default webhooks work instantly).
- Nominal / Most Likely (M): 85 hours (Custom seat-based pricing logic, dunning management, tax rate overrides, webhook retry state table).
- Pessimistic (P): 170 hours (Complex edge cases with prorations, currency conversions, race conditions in distributed payment events, regulatory invoice generation).
Applying the PERT formula yields:
σ = (170 - 40) / 6 = 21.67 Hours
Using one standard deviation, the engineering leadership can communicate to the finance committee that this specific subsystem requires between 70 and 113 hours with 68% statistical confidence, or between 48 and 135 hours with 95% confidence. Aggregating PERT values across all WBS items yields an unassailable financial envelope rather than an arbitrary target date.
Typical Software Budget Tiers in 2026
While every bespoke software initiative contains custom requirements, production software generally clusters into three distinct operational tiers based on data complexity, regulatory constraints, and architectural scale. (Note: The ranges below represent illustrative engineering estimates based on typical senior-led pod sizing, project duration, and architectural complexity, rather than rigid industry-wide fixed prices. Actual budgets depend heavily on team composition, compliance standards, and integration debt.):
| Tier / Scope | Investment Range | Timeline | Key Technical Characteristics |
|---|---|---|---|
| Tier 1: Targeted MVP / Operational Tool | \$35,000 – \$75,000 | 8 – 12 Weeks | Single-region monolithic backend, relational DB (PostgreSQL), Next.js frontend, basic Auth0 authentication, standard CRUD workflows, 2–3 third-party API integrations, automated CI build. |
| Tier 2: Scale-Up SaaS / Core Business Engine | \$80,000 – \$185,000 | 3 – 6 Months | Multi-tenant database schema, event-driven async workers (Redis/SQS), advanced RBAC, complex reporting dashboards, Stripe usage billing, SOC2 audit logging, multi-stage CI/CD with >75% automated test coverage. |
| Tier 3: Enterprise Platform / Regulated Core | \$200,000 – \$500,000+ | 6 – 12+ Months | Modular microservices or distributed domain architecture, high-concurrency event streaming (Kafka), multi-region active-passive failover, HIPAA/GDPR compliance, enterprise SSO (SAML/Okta), ERP core synchronization. |
The Hidden 60%: Total Cost of Ownership (TCO) Over 3 Years
The most dangerous financial mistake a technology executive can make is assuming that the capital expenditure (Capex) approved for the initial build represents the total budget. In reality, software is a dynamic operational asset that requires continuous capital maintenance.
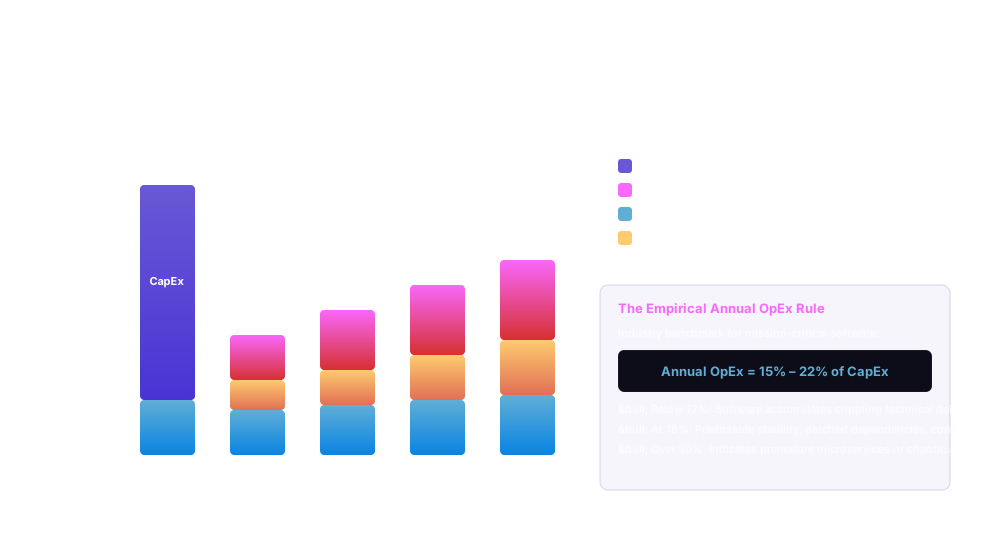
As demonstrated in Figure 2, year-two and year-three expenditures comprise four recurring cost categories:
1. Cloud Hosting, Database & Edge Infrastructure
Running a scalable cloud workload is never free. A scaling SaaS platform supporting 10,000 active business users typically incurs \$1,200 to \$4,500 monthly in cloud infrastructure across AWS, GCP, or Azure. These costs encompass multi-AZ RDS clusters, compute auto-scaling groups, Redis caching layers, S3 blob storage, CDN bandwidth, and CloudWatch or Datadog log retention. Without proactive cloud cost optimization (FinOps), idle compute sprawl can quickly inflate hosting bills by 40% annually.
2. Third-Party SaaS & API Subscriptions
Modern applications leverage managed services to accelerate time-to-market. These services introduce per-seat or usage-metered Opex that scales directly with user adoption:
- Authentication (Auth0 / Clerk): \$200 – \$1,200/mo depending on Monthly Active Users (MAUs) and Enterprise SSO connections.
- Transactional Email & SMS (SendGrid / Twilio): \$150 – \$800/mo based on transmission volume.
- Observability & APM (Datadog / Sentry / Honeycomb): \$300 – \$1,800/mo for trace retention, host telemetry, and error logging.
- AI Model Inference & Vector Embeddings: \$200 – \$3,000/mo if integrating intelligent parsing or semantic search.
3. Dependency Maintenance, Security Patches & Deprecation
Software decays if left untouched. Every enterprise application depends on hundreds of open-source packages and runtime libraries (Node.js, Python, React, Go). Industry data indicates that 15% to 20% of an application's dependencies release breaking updates or critical security vulnerabilities (CVEs) every year. Budgeting 15% to 20% of the original construction cost annually for dependency upgrades, API deprecation fixes, and database version migrations is mandatory to prevent terminal technical debt.
4. Ongoing Product Evolution
Launch is not the finish line; it is the starting point. Once live customers interact with the platform, market demand triggers requests for workflow enhancements, custom analytics, and partner integrations. A high-performing digital product requires ongoing sprint capacity—typically 1 to 2 dedicated engineers or an aligned external partner pod—to maintain competitive momentum.
Commercial Contracts: Fixed-Price vs. Time & Materials vs. Dedicated Pods
How you contract your software development partner significantly dictates the financial risk profile of the project. Selecting the wrong commercial structure frequently leads to adversarial finger-pointing or budget blowouts.
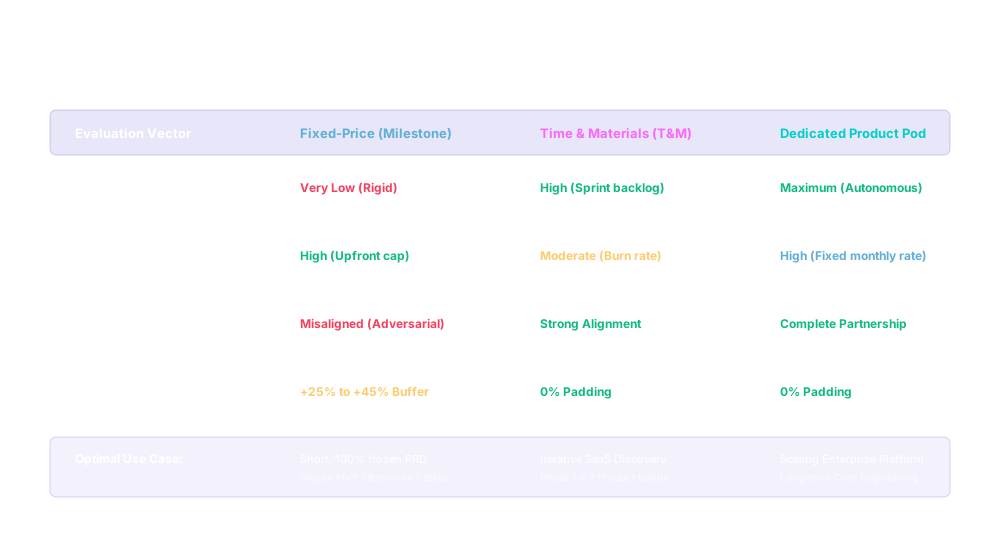
1. Fixed-Price Milestone
Best For: Small, rigorously specified projects (<\$50,000) with immutable requirements and zero architectural unknowns.
Tradeoff: The vendor builds a 30%–50% risk premium into the price. Any change request triggers cumbersome renegotiations and slows delivery velocity.
2. Time & Materials (T&M)
Best For: Exploratory R&D, rapid MVP validation, and complex refactors where technical scope cannot be known in advance.
Tradeoff: Maximum agility and instant pivoting, but requires strict sprint-level governance and budget caps to avoid scope creep.
3. Dedicated Senior Pod
Best For: Strategic products requiring 6+ months of dedicated engineering with predictable monthly burn.
Tradeoff: Delivers highest engineering velocity and lowest defect rate, but requires continuous product backlog leadership from the client.
A 5-Step Practical Checklist for Budgeting Custom Software
Before issuing an RFP or approving an internal capital budget, execute this 5-step engineering and financial checklist:
Define the Core MVP as a Strict Job-to-be-Done
Eliminate speculative "nice-to-have" features from Phase 1. If a feature does not directly solve the user's primary blocker or validate the unit economics of the transaction, postpone it to Phase 2. Reducing initial scope by 30% cuts risk by 60%.
Conduct an Architectural Discovery Sprint (2–3 Weeks)
Never sign a large development contract without a paid discovery sprint. Investing \$8,000 – \$15,000 upfront to map entity-relationship diagrams (ERDs), integration endpoints, and clickable prototypes reduces subsequent scope variance from 400% down to <20%.
Demand a WBS with Named Seniority Allocation
Require prospective development partners to supply a granular WBS backed by PERT estimates. Ensure the contract explicitly details who will execute the work, preventing the common "agency bait-and-switch" where senior partners pitch and junior trainees code. Review our Software Partner Technical Due Diligence Checklist for specific verification methods.
Mandate Automated Test Coverage in Contract Acceptance Criteria
Contracts that define delivery as "working software on staging" guarantee technical debt. Specify contractual acceptance gates: minimum 75% unit test coverage, zero critical SAST security findings, automated Playwright integration tests, and 100% Terraform-managed infrastructure.
Factor Year-1 Opex and Contingency into Initial Board Approvals
When presenting budgets to the board or CFO, present the full picture: Initial Build Capital + 20% Contingency Reserve + 12 Months of Hosting and Maintenance Opex. Transparent forecasting builds credibility and prevents mid-flight funding freezes.
Primary Research & Engineering References
- Boehm, Barry. Software Engineering Economics. Prentice-Hall (Foundational formulation of the Cone of Uncertainty and COCOMO cost estimation models).
- McConnell, Steve. Software Estimation: Demystifying the Black Art. Microsoft Press (Practical WBS breakdown, PERT three-point distributions, and progressive elaboration).
- Project Management Institute (PMI). A Guide to the Project Management Body of Knowledge (PMBOK Guide) — Standardized Work Breakdown Structure (WBS) principles.
- FinOps Foundation. State of FinOps Report (2025/2026) — Industry cloud spend metrics, waste percentages, and total lifecycle unit economics.
Planning a Mission-Critical Software Initiative?
Ramaaya Technologies partners with ambitious founders and enterprise leaders to design, architect, and engineer high-performance custom software with predictable budgets and zero technical debt.