

Why Cloud Bills Grow Faster Than Business Revenue
In traditional on-premises data centers, capacity was constrained by physical hardware delivery cycles. Engineering teams were forced to plan capacity months in advance, submit formal procurement requests, and operate within fixed physical racks.
The cloud inverted this paradigm. Elastic infrastructure unlocked unprecedented shipping velocity, but eliminated all friction in provisioning compute, memory, and bandwidth. Over a company's scaling journey, multiple factors quietly decouple cloud spending from customer growth:
- Provisioning for Hypothetical Headroom: Engineers routinely provision virtual machines (EC2, Google Compute Engine) sized for theoretical holiday peaks, leaving CPU utilization hovering between 8% and 15% for months.
- The Abandoned Resource Graveyard: Terminated instances frequently leave behind unattached persistent disks (EBS volumes), stale snapshot trees, and unassociated Elastic IP addresses that continue generating billing line-items indefinitely.
- Always-On Staging & QA Environments: Non-production environments run 24 hours a day, 7 days a week (168 hours per week), even though engineering squads only write and test code for roughly 45 hours weekly. Companies pay for 123 hours of completely idle infrastructure every single week.
- Hidden Network & NAT Gateway Surcharges: Traffic routed across Availability Zones or through public NAT gateways to access internal S3 buckets incurs heavy data transfer processing fees that rarely appear in initial architectural projections.
The FinOps Framework: Inform, Optimize, Operate
Financial Operations (FinOps) is not a finance department auditing exercise. It is an engineering discipline that brings financial accountability to the variable spend model of cloud computing. The FinOps Foundation structures this discipline into three continuous phases:
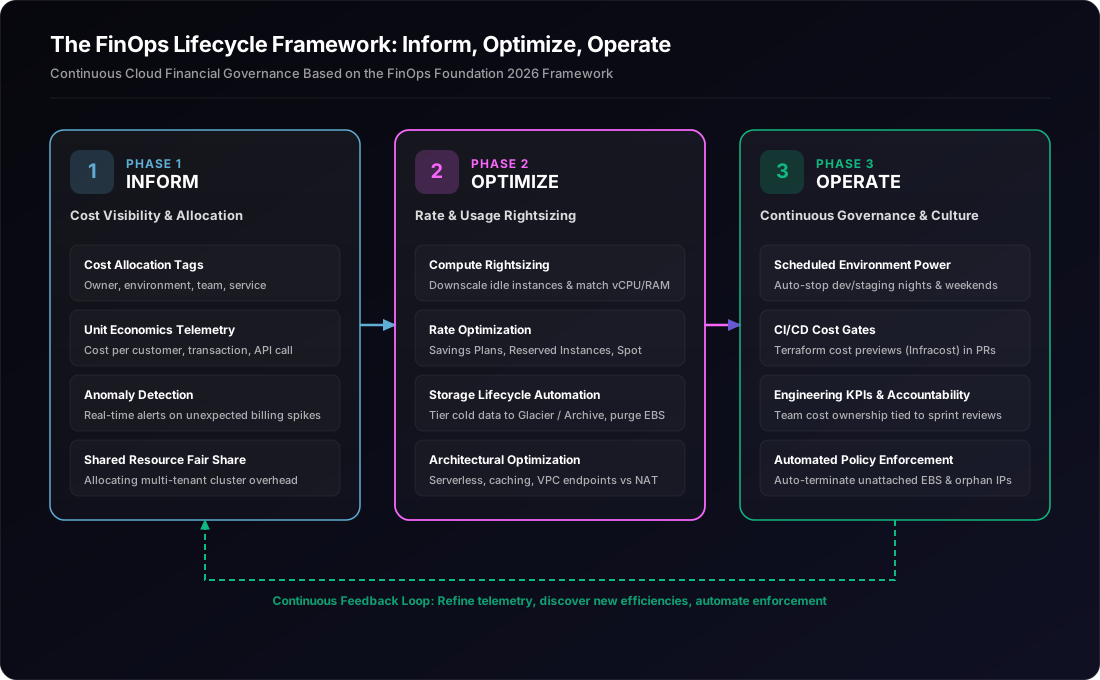
Phase 1: Inform (Visibility & Allocation)
You cannot optimize what you cannot measure. The Inform phase focuses on making cloud costs visible, allocated, and understood:
- Mandatory Cost Allocation Tagging: Enforce tags via infrastructure-as-code (Terraform / OpenTofu) for
Environment(prod, staging, dev),Service(auth, billing, search),Owner(team or squad lead), andCostCenter. Untagged resources are flagged and scheduled for quarantine. - Cost Anomaly Detection: Configure automated alerts (such as AWS Cost Anomaly Detection or GCP Anomaly Alerts) that trigger in Slack whenever daily spend deviates more than 20% from historical moving averages.
- Shared Cost Fair-Share Models: Determine how shared infrastructure (Kubernetes worker nodes, centralized Kafka brokers, bastion hosts) is apportioned across teams rather than dumped into an unassigned corporate bucket.
Phase 2: Optimize (Usage & Rate Efficiency)
Once visibility is established, teams systematically address usage waste and pricing rate opportunities:
- Compute Rightsizing: Analyze 30-day P95 and P99 CPU and memory metrics. Downscale oversized instance families (e.g., migrating an underutilized
m5.2xlargedown to a modern Graviton-basedm7g.large), matching instance sizes to real workloads. - Commitment Rate Optimization: Once baseline non-variable usage is established, cover 60% to 75% of steady-state compute with 1-year or 3-year Compute Savings Plans or Reserved Instances to lock in 30% to 60% discounts.
- Storage Lifecycle Policies: Configure automated S3 bucket rules that transition logs and raw payloads to S3 Standard-Infrequent Access after 30 days and Glacier Deep Archive after 90 days, with expiration policies deleting temporary debug files.
Phase 3: Operate (Continuous Governance & Culture)
Optimization fails if bills creep back up the following quarter. The Operate phase bakes financial hygiene directly into daily engineering habits:
- Scheduled Non-Production Shutdowns: Use automated AWS EventBridge rules or tools like Instance Scheduler to shut down all staging, demo, and sandbox environments at 7:00 PM on weekdays and leave them off through weekends. This alone eliminates ~65% of non-production compute bills.
- Infracost CI/CD Checks: Integrate cost-estimation tools into pull requests. When an engineer modifies a Terraform file, an automated bot comments on the PR: "This change adds +$340/month in cloud spend."
- Team-Level Cost Ownership: Review cloud spend during bi-weekly sprint retrospectives, treating budget overruns as technical debt alongside latency and error budgets.
The Anatomy of Cloud Waste in Growing Tech Companies
Before attempting complex architectural rewrites, technical leaders should examine where wasted dollars actually concentrate. In our cloud consulting engagements at Ramaaya Technologies, we repeatedly identify five primary culprits:
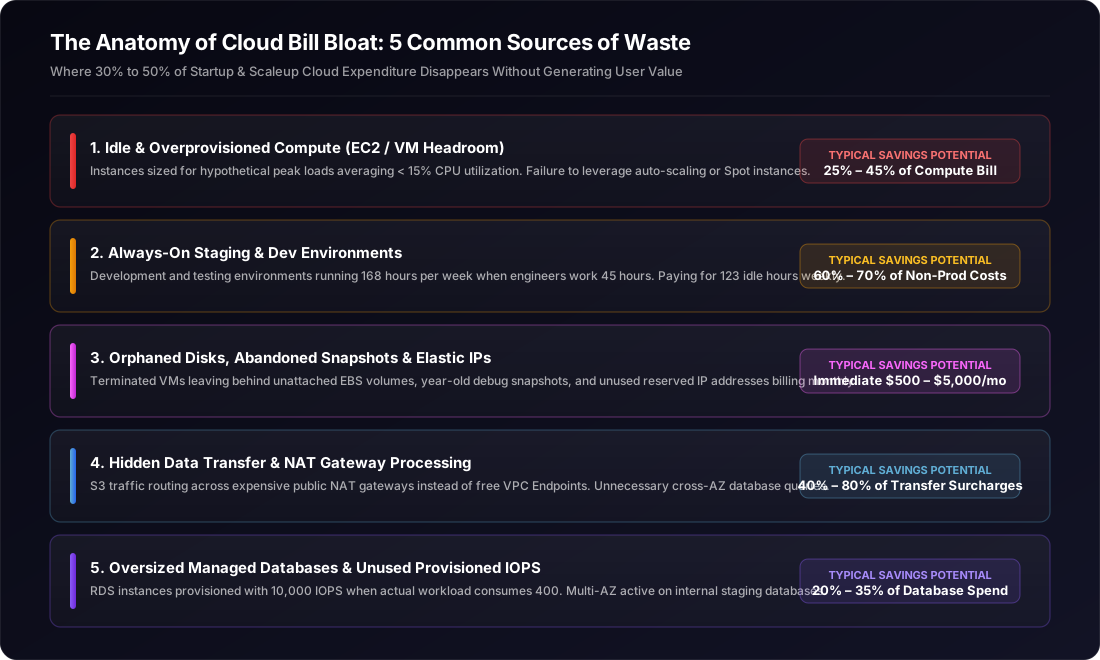
| Waste Source | Root Cause | Pragmatic Remedy | Typical Savings |
|---|---|---|---|
| Overprovisioned Compute | Instances sized for worst-case spike; fear of CPU throttling | Target-tracking autoscaling; Graviton migration; rightsizing to P95 load | 25% – 45% of compute bill |
| 24/7 Staging Environments | Dev/QA instances running continuously over nights and weekends | Automated scheduled sleep scripts (Monday-Friday, 8am-7pm only) | 60% – 70% of non-prod costs |
| Orphaned Disks & IPs | Terminated VMs leaving behind unattached EBS volumes and snapshots | Automated cleanup lambda scripts; AWS Trusted Advisor alerts | $500 – $5,000/mo immediate |
| NAT Gateway Transfer | Internal S3/DynamoDB traffic traversing public NAT endpoints | Deploy free VPC Gateway Endpoints for S3 & DynamoDB | 40% – 80% of data transfer fee |
| Oversized Relational DBs | RDS provisioned with excessive IOPS and multi-AZ enabled in staging | Disable Multi-AZ on dev DBs; drop provisioned IOPS to gp3 baseline | 20% – 35% of database spend |
The Trap: When Blind Cost-Cutting Destroys Engineering Velocity
A critical warning for technical decision-makers: cost optimization is not the art of finding the cheapest possible machine. Blind cost-slashing creates architectural fragilities that cost far more in developer downtime and lost customer trust:
- Starving Database Memory: Downgrading an RDS instance from
db.r6g.xlargetodb.t4g.mediumto save $180/month can cause database buffer pool thrashing, spiking disk I/O and causing 10-second API timeouts across production. - Aggressive Spot Instances on Fragile Workloads: Running stateful web backends on Spot instances without graceful shutdown handlers will trigger random 502 Bad Gateway outages when AWS reclaims capacity with 2-minute notice. Spot instances are suitable for stateless worker queues, video encoding, and batch jobs—not transactional web APIs.
- Premature Multi-Cloud Orchestration: Building complex abstraction layers across AWS, GCP, and Azure to chase spot price arbitrage adds hundreds of thousands of dollars in developer complexity for negligible compute savings.
Connecting Cloud Infrastructure to Unit Economics
A $30,000 monthly AWS bill tells an executive nothing about company health. If that bill supported 1,000 customers last year ($30/customer) and now supports 10,000 customers ($3/customer), your infrastructure efficiency improved tenfold despite a flat or slightly higher absolute bill.
Growing businesses must translate raw infrastructure line-items into business unit economics:
- B2B SaaS: Cost per Active Tenant / Customer per Month. (Learn how database isolation models affect multi-tenant infrastructure costs in our guide on B2B SaaS Multi-Tenant Architecture).
- Fintech / Payments: Infrastructure Cost per Settled Transaction.
- AI & Automation Platforms: Compute & Token Cost per Workflow Execution or Document Processed.
- E-Commerce / Marketplace: Hosting Cost per Order Placed.
Tracking unit economics reveals whether application architecture scales linearly, logarithmically, or exponentially with business growth. If your cost per customer increases as you acquire more users, your software architecture suffers from architectural bottlenecks (such as unindexed queries or unbounded background jobs) that require refactoring.
The 30-Day Cloud Cost Assessment Framework
For technical founders, CTOs, and engineering leads looking to establish FinOps control, we recommend this structured 30-day assessment sprint:
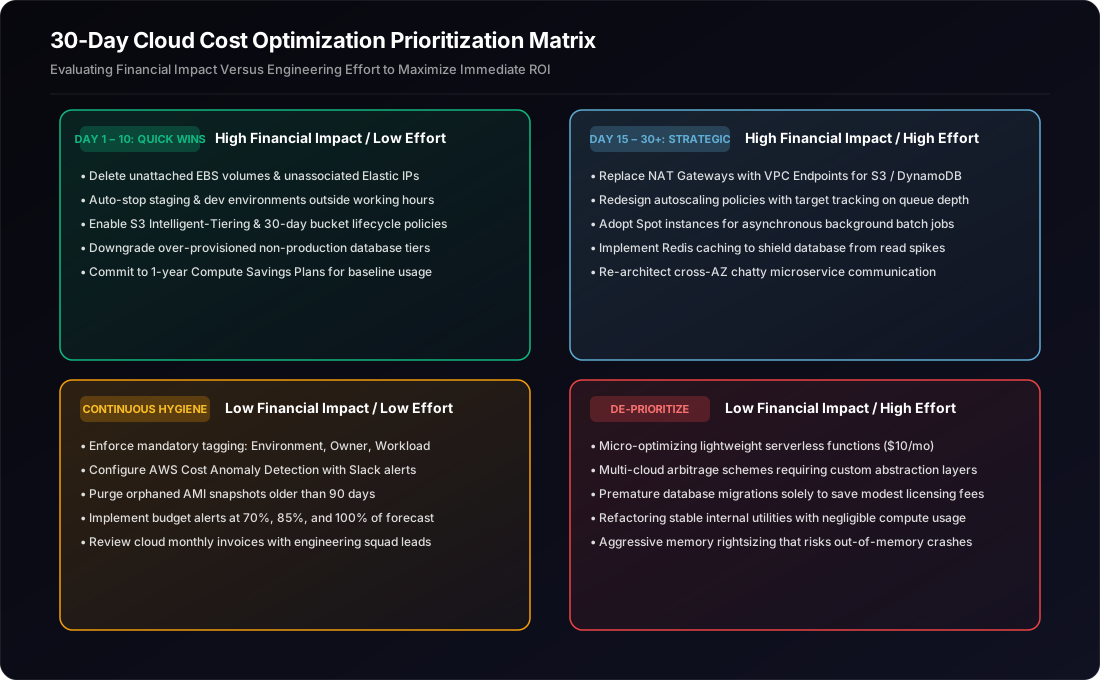
Days 1 – 5: Tagging, Visibility & Zombie Resource Purge
Deploy automated billing tags across all resources. Run scripts to identify and immediately terminate unattached EBS storage volumes, obsolete AMI snapshots older than 90 days, and unassociated Elastic IP addresses. Configure AWS Cost Anomaly Detection with webhooks into your engineering team's Slack channel.
Days 6 – 12: Automated Non-Production Scheduling
Implement an automated cron schedule that powers down all development, testing, staging, and demo environments at 7:00 PM on weekdays and leaves them off throughout the weekend. Disable expensive Multi-AZ replication and automated performance insights on internal non-production databases.
Days 13 – 19: Compute Rightsizing & Graviton Evaluation
Analyze CloudWatch / Datadog 30-day utilization metrics. Downscale virtual machines whose average CPU utilization remains below 20%. Where feasible, migrate Intel/AMD instance types (e.g. c5, m5) to ARM-based Graviton3/4 instances (c7g, m7g) to capture immediate 20% cost savings at superior price-to-performance.
Days 20 – 25: Storage Lifecycle Policies & VPC Gateway Endpoints
Enable S3 Intelligent-Tiering across all object storage buckets to automatically tier infrequently accessed objects into cold storage. Deploy free VPC Gateway Endpoints for Amazon S3 and DynamoDB to route high-bandwidth internal traffic directly, completely bypassing costly public NAT Gateway data processing fees.
Days 26 – 30: Baseline Savings Plans & Unit Economics Baseline
Review newly stabilized compute baselines. Purchase 1-year No-Upfront Compute Savings Plans covering approximately 65% to 75% of your steady-state usage to secure baseline discounts without locking yourself into rigid instance types. Calculate your initial cost-per-customer unit economics metric and present findings to executive leadership.
The Ramaaya Perspective: Architecture Governs Economics
At Ramaaya Technologies, our systems architects approach FinOps not as an aggressive spreadsheet slashing exercise, but as a direct reflection of software architecture maturity.
The most expensive cloud component is almost never a server; it is architectural inefficiency disguised as infrastructure demand. When an application has poorly indexed relational tables, missing Redis caching layers, or chatty cross-service microservice networks, the engineering team inevitably throws larger instances at the problem to mask latency.
Our engineering practice partners with scaling businesses to review system architecture, eliminate infrastructure waste, and build scalable backends that protect operating margins:
- Cloud & Data Infrastructure: Designing resilient, rightsized cloud architectures across AWS, GCP, and hybrid environments. Explore our Cloud & Data Engineering Services.
- Software Architecture Reviews: Auditing database schemas, caching layers, and bottlenecks before scaling. Read our guide on Software Architecture Reviews.
- Technology Advisory & Discovery: Aligning engineering initiatives with unit economics and business ROI. Learn about our IT Consulting & Strategy Practice.
Conclusion: What Should Your Business Do This Week?
Do not attempt to overhaul your entire cloud topology in a single sprint. Start on Monday with foundational visibility:
- Log into your cloud billing console and identify the top three line-items driving 80% of your total monthly expenditure.
- Audit your unattached storage volumes and orphan snapshots—you will likely find several hundred dollars of immediate, zero-risk waste.
- Put your non-production staging environments on a night and weekend sleep schedule.
- Enforce cost allocation tags in your CI/CD pipelines so every dollar spent maps to a squad or service owner.
Cloud cost optimization is ultimately about engineering velocity: every dollar saved on idle infrastructure waste is a dollar that can be reinvested into hiring senior engineers, refining product features, and acquiring customers.
Sources & Authoritative References
This analysis synthesizes frameworks and research data from authoritative cloud standards:
- FinOps Foundation: "State of FinOps 2026 Report". View Data at data.finops.org — Survey analysis of 1,192 respondents representing over $83B in annual cloud spend.
- FinOps Foundation: "The 2026 FinOps Framework". View FinOps Framework — Practitioner principles for Inform, Optimize, and Operate phases.
- AWS Well-Architected Framework: "Cost Optimization Pillar". View AWS Well-Architected Guidance — Core design principles for expenditure awareness, matching supply with demand, and architectural trade-offs.
- Related Ramaaya Architectural Guides: B2B SaaS Multi-Tenant Architecture Guide · Custom Software vs SaaS: Build vs Buy Economics · Monolith vs Microservices for Growing SaaS